Author: Sasha Mayn
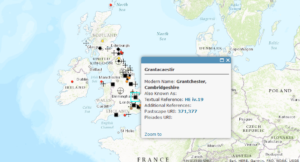
I have spent a large portion of my worktime this term looking at mapping tools and ways of visually representing different kinds of geographic data. We used ArcGIS for creating a map of Bede’s England (you can read more about it here) and that worked really well for the purposes of the project: it allowed to denote different types of objects (e.g., a town, a monastery, etc.) with different symbols and link pages that alluded to those places and gave a clear visual representation of the objects. However, as much as I love ArcGIS (I think it’s really cool!), one can imagine wanting to do certain things with maps that it’s not perfect for.
This term I started working on the Carleton Guide to Medieval Rome to which students who go on the Carleton Rome OCS program contribute pictures and stories about different monuments and places in the Medieval city. The goal is for site visitors to be able to go on a particular “walk” and, while on that walk, learn about the pieces of the Medieval Rome they encounter along the way. So I have started looking for a platform that might be better suited for this goal than ArcGIS and found a really nifty one – Neatline, an exhibit builder that uses Omeka items to create interactive stories including timelines, pictures and georeferenced historical maps (I’ll explain what that means below). I have only started playing around with it but have already discovered a wide array of really great tools.
First, you can use actual historical maps (scanned images of old maps, that is) to overlay the basemap. That is a fantastic visual way of integrating the ancient or Medieval city into a modern one – and bring a historic map back to life! I used an 1830 map of Rome from David Rumsey map collection above (“1830 is not Medieval!” you might astutely observe. You are totally right – I picked this one as an example mostly because I liked how it looked). To do that, I had to georeference the map – a fancy term for identifying several common points on both maps – using a very straightforward online tool called MapWarper and then exported it to Neatline.
Then I added a couple of objects onto the map – in the screenshot above you can see the Temple of Hadrian, or Hadrianeum. I first created a new item in Omeka and then imported it into the Neatline exhibit – you can import all items with a certain tag which will be handy if a lot of images need to be added. Neatline places the point on the map for you if you include the coordinates in the metadata – that part turned out much more confusing than it sounds, however. It turns out that the coordinates need to be in a very specific format, WKT (or well-known text). Wikipedia told me that the format for a point is POINT(# #). Unexpectedly, when I entered the lat and long numbers, Neatline placed the temple of Hadrian…in the ocean off the west coast of Africa. After some frustratingly futile googling, I found out that the coordinate WKT uses coordinates in a coordinate system called Pseudo-Mercator, and the lat and long values need to be flipped (I’m still puzzled by all of that).
In addition to adding points on the map, you can also add lines and geometric shapes. Lines of different colors and points could be used to represent different walks across the Medieval city of Rome – I’m excited to try that and see how it turns out!


