One tool that can be used for Digital Humanities is the Gale Digital Scholar Lab (henceforth: GDSL). GDSL is a database of various texts that can be used for analyzing, finding, cleaning, and organizing data using natural language processing (NLP). The toolset for textual analysis provided by GDSL includes document clustering, named entity recognition, n-grams, parts of speech, sentiment analysis, and topic modeling. All these analyses can be used to understand and categorize data in different ways. Such analyses are useful for scholars who aim to study trends and correlations in texts of any certain types. Currently, Carleton has access to 21 textual databases including American Fiction 1774-1920, American Historical Periodicals from the American Antiquarian Society, Archives of Sexuality and Gender, Archives Unbound, British Library Newspapers, Decolonization: Politics and Independence in Former Colonial and Commonwealth Territories and more.
In this blog, I aim to study one of these tools provided by GDSL and present ways to make it more precise and exhaust more of its capabilities. This tool of analysis is Document Clustering. To begin document clustering, first of all, we need to search for appropriate data that can be used to create a Content Set. The Advance Search feature can be used to generate Content Sets with specific characteristics. Search operators and special characters can further help in creating precise content sets.

A combination of different search terms, operators, and special characters would result in the generation of an appropriate dataset. One important parameter that can be used is “word1 nx word2” where x stands for the number of possible words between word 1 and word 2. For example, if you want to see all the sources in which “Ireland” is mentioned in 10 spaces near “Finland”, you can search “Finland n10 Ireland”. After searching, you will see all your results and they can be added to the content set by selecting the “Select All” and “Add To Content Set” options.

Once you have created the Content Set, it can be used for further analysis. As you can see, I got 53 results and I have added all of them in a test content set. Now, I will use Document Clustering tool on this content set. The document clustering tool can be accessed by My Content Sets > Analyze > Document Clustering.


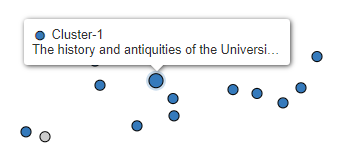
By clicking the “Run” option, you will be able to run the analysis on the given dataset. I have run a basic analysis on my dataset. Now, I will show you how the output of the analysis can be better understood and utilised to the best extent. This is the initial output of my first run with two clusters.
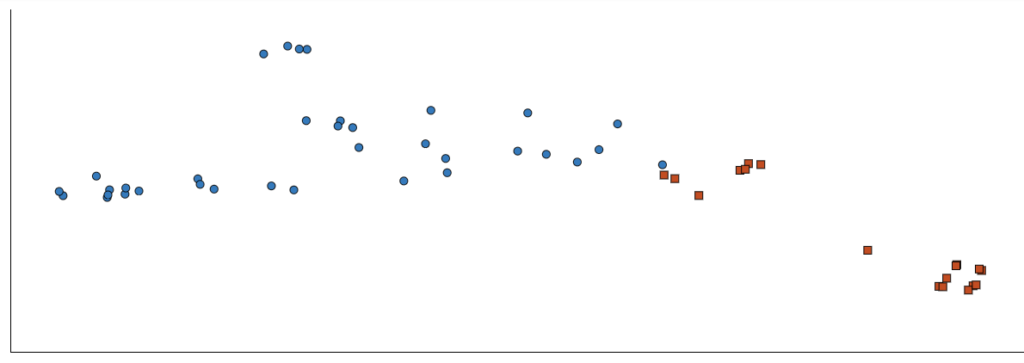
Please note that GDSL does not tell you what the y-axis or x-axis is but there are ways you can understand the output in a more comprehensive manner. The very first thing to do is to just manually compare and contrast the data points available in the two clusters. I attempted to do this with the clusters I generated. I saw that cluster 2 (the orange cluster) contained more philosophical works whereas cluster 1 (blue cluster) contained more general works such as history, literature and news. This gives me a general idea of what the x-axis (or perhaps the y-axis) might mean for this graph. The higher the x value, the more philosophical the work might be.

Another good way to understand the output is to increase the number of clusters. You can change the cleaning configuration and No. of clusters of the tool by going to Document Clustering > Tool Setup (grey toolbar on left) > Cleaning Configuration/Number of Clusters. Below is the setup I used for my second test run. Rather than using 2 clusters only, I used 3 clusters.

The graph generated for 3 clusters looked like this:

Given this cluster, I aimed to find out the main difference between the three clusters. I found out that the third cluster in this graph only included magazines. The second cluster also included magazines (but more of an academic nature rather than literati nature).

In addition to this, you can also revise your dataset and search for terms in them. This can also help you find out what are the classifications being made in the clusters. It would not always be obvious what the cluster contains but a close look and analysis can provide more information.